
Case study · United Arab Emirates
Al Marjan Island, Ras Al Khaimah
A reclaimed coral-shaped archipelago, five years of Sentinel-2, and one question: is the landscape maturing as fast as the built form is arriving?
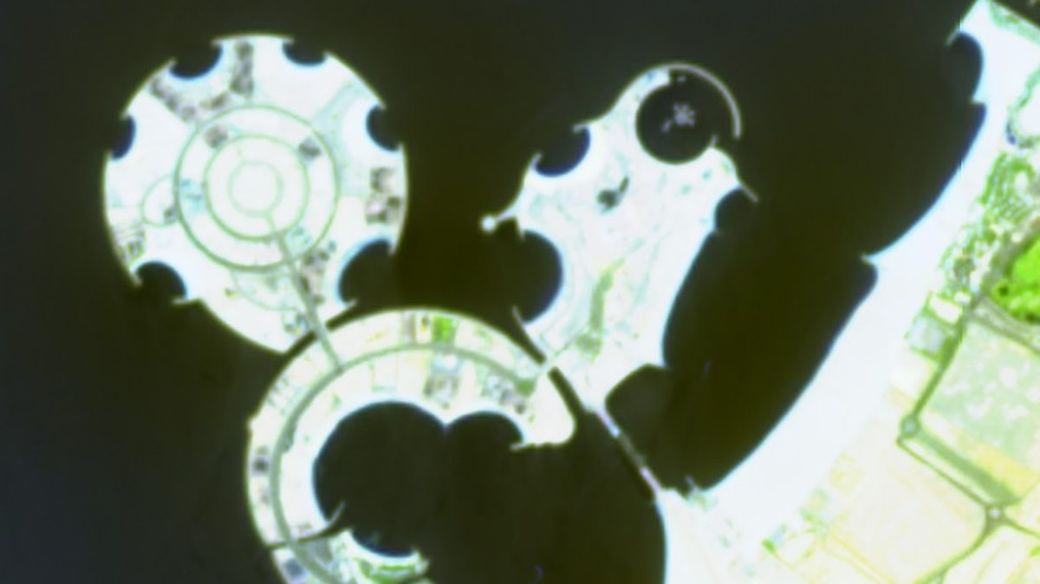
of new island land in five years — 317 → 354 ha, up 12%
of island land vegetated, up from 2.5% in 2021
vegetated on Palm Jumeirah, measured the same way
to close that gap at the observed rate of +0.20 points a year
The question the frame could not answer
The first pass over Al Marjan used area-wide index time series — the standard approach, and the wrong one here. The analysis frame is 60% seawater; the mainland accounts for another 34%. The islands themselves are 5.7% of the frame. Any signal originating on the islands is diluted roughly twentyfold in an area-wide average, which is precisely why the first look saw nothing.
So we stopped averaging and started segmenting. Sentinel-2 Level-2A scenes were read directly from public cloud-optimised archives — six low-cloud summer scenes per epoch, masked pixel-by-pixel with the scene classification layer and reduced to a per-pixel median. Water was separated from land by Otsu thresholding on NDWI rather than a hand-picked cut, and the islands were separated from the mainland by eroding the land mask, labelling the connected components, then dilating the seeds back — because the causeways otherwise weld the archipelago to the shore and the whole thing labels as one landmass.
Al Marjan is hardening far faster than it is greening — and the gap is not closing at a rate anyone would plan around.
The benchmark
A vegetation share means nothing on its own. It needs a comparable. We ran the identical pipeline over Palm Jumeirah — the same construction concept, the same climate, roughly twenty years older — to answer what a mature reclaimed island in the Emirates actually looks like from orbit.
| Measure | Al Marjan 2021 | Al Marjan 2026 | Palm Jumeirah 2026 |
|---|---|---|---|
| Island land area | 317 ha | 354 ha | 488 ha |
| Vegetated area (NDVI > 0.20) | 7.8 ha | 12.4 ha | 102 ha |
| Vegetated share of land | 2.5% | 3.5% | 20.9% |
The gap is 6.0×, or 17.4 percentage points. Al Marjan's observed greening rate is +0.20 points a year. Held at that rate, the gap closes in about 86 years — which is another way of saying the landscape is not on a trajectory toward the benchmark at all, and that closing it is a decision to be taken rather than a maturation to be waited out.
The climate the asset will operate in
Two climate signals survived robustness testing on a 25-year record, and both matter to anyone operating or underwriting on this coast.
- Cooling demand is rising. Cooling degree-days moved 3,994 → 4,170, a Theil–Sen slope of +19.75 a year at p = 0.043.
- Rainfall is rising, and rising fast. +4.4 mm a year at p = 0.004 — 72 mm to 128 mm between the halves of the record, with 2024 delivering 274 mm against a 2001–04 baseline of 49 mm. For a low-lying reclaimed island, that is a drainage question, not a weather anecdote.
Two more signals did not reach that bar and are reported accordingly. Days above 40 °C show no trend whatsoever (Mann–Kendall Z = 0.00). Thermal comfort days fell from 134 to 112 between the two five-year windows — a 16% reduction — but at p = 0.073 on eleven years, that is a level shift worth noting, not a trend worth extrapolating. Solar resource sits at 5.67 kWh/m²/day, roughly 2,071 kWh/m² a year.
Four findings from the first analytical pass were withdrawn before delivery. Each one would have been publishable; none of them was true.
- A build-out index based on NBR. Two independent errors. The interpretation was backwards — on land, NBR correlates positively with vegetation (r = +0.39), so rising NBR means more green, not more concrete. And 81% of the apparent rise came from water pixels, where both bands sit near zero and the ratio swings on noise.
- "Peak vegetation fell 25%." Ordinary least squares gave −0.0155/yr at t = −2.24. Theil–Sen gives −0.0009/yr and Mann–Kendall p = 0.45: the fit was levered by a single anomalous year. Restated as flat — which turned out to be the stronger finding, because flatness against rapid hardening is the story.
- "The water share is shrinking." Residual autocorrelation of 0.77 collapses the effective sample from 283 to 36. Corrected, t = −0.68. The shoreline is stable; the waterfront is a fixed cap, and growth from here is vertical.
- "Dust days rose from 8% to 24%." A pure sampling artefact — the first year covered only the low season and the last only the high season. Month-matched, the series runs 33.5% · 13.6% · 9.0% · 14.6% · 24.1%: volatile, with no trend. The May–August seasonal peak is real and unaffected.
Method: Sentinel-2 L2A surface reflectance read from public cloud-optimised archives via STAC; six low-cloud scenes per epoch, SCL-masked per pixel, per-pixel median composites; land–water separation by Otsu threshold on NDWI; island segmentation by erosion–label–dilate to defeat causeway bridging. Climate from NASA POWER and ERA5. All trends reported with Theil–Sen slope, Mann–Kendall significance and AR(1) effective-n correction. Contains modified Copernicus Sentinel data 2021–2026.
Related
Two more Emirates assessments.
A blue-carbon valuation in Abu Dhabi and a 25 km² urban baseline in Dubai.