
Case study · United Arab Emirates
Jubail Island blue carbon, Abu Dhabi
How much carbon does an arid-coast mangrove system actually hold, how much is it adding each year, and how much more ground is genuinely available to plant?
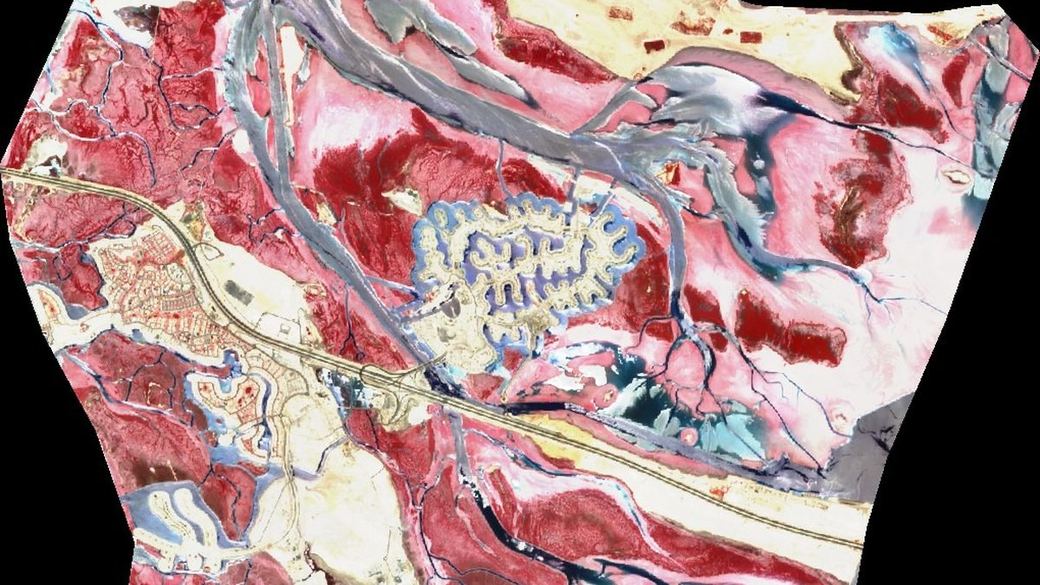
established mangrove canopy — dense core ~1,800 ha
CO₂e stored in biomass and soil to 1 m (range 0.7–1.9 Mt)
CO₂e sequestered annually at current extent
restoration-ready intertidal flat, worth a further ~0.8 Mt at maturity
A stand that is stable, not merely present
Extent is the easy half of a blue-carbon question. The harder half is condition: a mangrove system that is losing canopy year-on-year cannot be valued as though it were holding steady, and a single dry-season image cannot tell the two apart.
We built a five-year record instead — 746 Sentinel-2 acquisitions over the tidal system, of which 462 were retained at 10% cloud cover or better — and read seven indices across the whole series: NDVI, EVI, SAVI and ARVI for vegetation vigour, NDWI and the Moisture Index for water and tidal state, and NBR for structure. Extent was fixed by thresholding NDVI on each scene's own distribution rather than against a global constant, which keeps the measurement stable across tide and sun-angle variation.
Seasonal amplitude under 6% and a five-year trend that is essentially flat: this is an evergreen, stable, healthy stand — and it can be valued as one.
From extent to carbon
Carbon is mapped extent multiplied by published coefficients for arid-zone Avicennia marina — 108 to 190 tonnes of carbon per hectare, biomass plus soil to one metre — converted to CO₂e at 3.67. That produces a central estimate of 1.1 Mt CO₂e stored, with a defensible range of 0.7 to 1.9 Mt, and an annual increment of roughly 7,340 t CO₂e.
The restoration figure is the one with commercial weight. Around 1,500 ha of intertidal flat inside the study boundary sits at an elevation and inundation regime that would support planting — enough to add approximately 0.8 Mt CO₂e at maturity, roughly a 70% increase on the standing stock.
| Measure | Value | Basis |
|---|---|---|
| Study area | 11,898 ha | 32-vertex tidal boundary polygon |
| Dense canopy core | ~1,800 ha | Sentinel-2 NDVI, per-scene threshold |
| Total canopy including sparse | ~2,785 ha | Sentinel-2 NDVI, per-scene threshold |
| Stored CO₂e | ~1.1 Mt | Extent × arid-mangrove coefficients, 108–190 t C/ha |
| Annual sequestration | ~7,340 t/yr | Extent × published accumulation rate |
| Restoration-ready flat | ~1,500 ha | Elevation and inundation screening |
| Seasonal canopy amplitude | < 6% | Five-year index series, 462 clear scenes |
Every carbon figure here is a model estimate: mapped extent multiplied by published coefficients. It is screening-grade — the right instrument for deciding whether a site is worth a field inventory, and the wrong instrument for issuing anything.
Two limits are worth stating plainly, because they hold for every carbon assessment we produce. Soil organic carbon cannot be read from orbit, so a programme that reaches the transaction stage still needs physical sampling — we size that sampling, we do not replace it. And we do not issue carbon credits; accredited registries do. Our role is the area, the condition and the permanence evidence underneath a registry submission.
Independent corroboration
The strongest argument for an extent figure is that it agrees with someone else's. The same engine, run over the Indus Delta in Sindh, mapped 123,400 ha of mangrove — a figure that sits between Global Mangrove Watch's 143,900 ha and Delta Blue Carbon's 102,000 ha. Two independent references, bracketing our result from both sides, on a system an order of magnitude larger than Jubail.
Method: Copernicus Sentinel-2 L2A, 10 m, July 2021 – July 2026; 746 acquisitions, 462 retained at ≤10% cloud; indices NDVI, EVI, SAVI, ARVI, NDWI, Moisture Index, NBR; extent by per-scene NDVI distribution thresholding within a 32-vertex tidal boundary; carbon by extent × published arid-mangrove coefficients, C → CO₂e × 3.67. Contains modified Copernicus Sentinel data 2021–2026.