
Case study · United Arab Emirates
Dubai Silicon Oasis urban baseline
What a digital twin needs before it can be trusted: one exact district frame carrying terrain, drainage, land cover, built form, population and canopy — plus the twenty-six-year record of how it got there.
The problem with district-scale analysis
Cities are analysed either at the building or at the emirate. The scale that actually carries planning decisions — the district — falls between them, and it is where most geospatial work quietly loses its exactness: an approximate boundary produces approximate area, and every per-hectare figure downstream inherits the error.
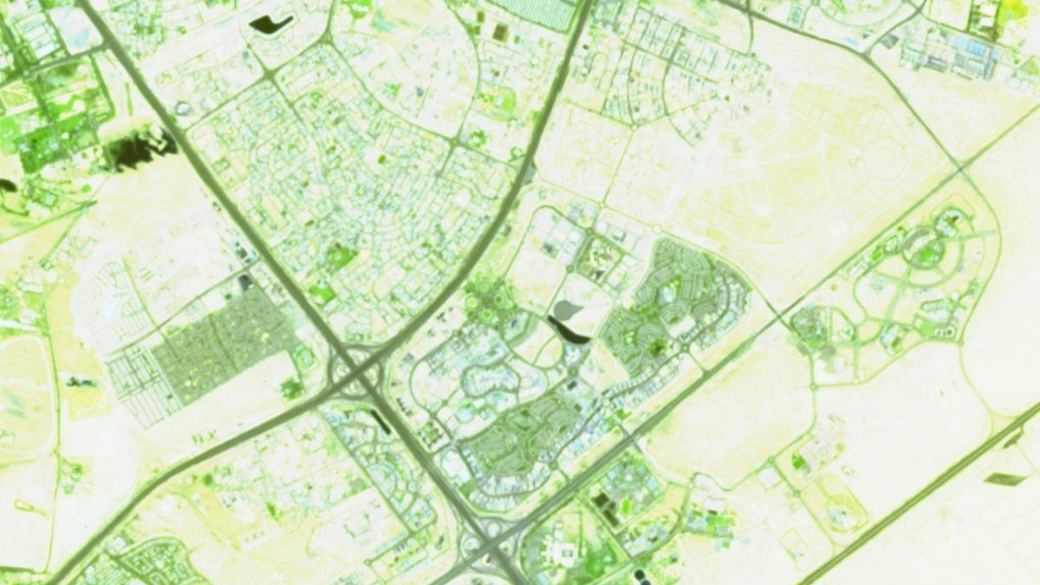
So the study began with an exact frame: a 5.00 × 5.00 km rectangle over the Nad Al Sheba–Academic City–Silicon Oasis corridor in eastern Dubai, independently verified at a 19.97 km perimeter and 24.99 km². Every layer, index and change statistic in the assessment is computed against that same boundary, so the numbers compose.
Twenty-five layers on one exact frame — the substrate a digital twin needs, assembled, reconciled and verified against a single verified boundary.
What the frame carries
- Copernicus GLO-30 elevation, 30 m
- Aspect, 10 m
- Inundation history — percentage of time wet, 1999–2020, which is the layer that tells you where water has actually stood rather than where a model says it should
- ESA WorldCover land cover, 10 m
- Forest and tree cover, 10 m
- Building footprints
- Land parcels and localities
- Storm drains and maintenance covers
- Fire hydrants and street lighting
- Traffic signals, stop and speed-limit signage
- Cycle infrastructure
- Population — GHSL and WorldPop
- Postal geography
- EV charging provision
- Tree canopy share
Twenty-six years, one viewpoint
Alongside the layer stack, the assessment carries a fixed-viewpoint growth record: the same frame in 2000 (bare desert), 2010 (the first campus and its gardens), 2015 (the lake filled), 2025 (near build-out, with rooftop solar visible) and 2026 (infill). Held at one viewpoint, the sequence turns an argument about pace of development into something a planning committee can simply look at.
Underneath it sits a denser quantitative record: 479 NASA Harmonised Landsat–Sentinel acquisitions from January 2020 to July 2026 over the exact AOI, each paired with its quality mask, plus a five-year Sentinel-2 index series for vegetation and water. Eleven spectral composites of a single reference date — true and false colour, NDVI, NDWI, urban classification, SWIR, thermal infrared and two geological band combinations — give the same district read eleven different ways.
What a district baseline is for
A frame like this is not a report; it is the layer everything else is measured against. Drainage can be right-sized against inundation history rather than a design storm assumption. Development control can be checked against what was actually built, at whatever cadence the archive allows. Canopy and cooling commitments become measurable instead of aspirational. And when the next study over this district is commissioned, it starts from an established, verified baseline rather than from nothing.
Method: AOI fixed as an exact 5.00 × 5.00 km rectangle, independently verified for perimeter, area and elevation range. Layers drawn from Copernicus DEM GLO-30, ESA WorldCover, open building and parcel data, GHSL and WorldPop. Optical record from NASA HLS S30 v2.0 (479 acquisitions with paired quality masks, 2020-01-04 to 2026-07-18) and Copernicus Sentinel-2 L2A five-year index series. Contains modified Copernicus Sentinel data 2021–2026.